
Paper/ Subject Code 86001/ Operation Research
TYBMS SEM 6
Operation Research
(Q.P. April 2023 with Solution)

1) April 2019 Q.P. with Solution (PDF)
2) November 2019 Q.P. with Solution (PDF)
3) November 2022 Q.P. with Solution (PDF)
4) April 2023 Q.P. with Solution (PDF)
5) November 2023 Q.P. with Solution (PDF)
6) April 2024 Q.P. with Solution (PDF)
7) April 2025 Q.P. with Solution (PDF)
8) Objective Questions with Solution (PDF)
9) Most Important Write a Short Notes with Solution (PDF)
Please check whether you have got the right question paper.
Note:
1. All questions are compulsory. (Subject to Internal Choice)
2. Figures to the right indicate full marks
3. Use of non-programmable calculator is allowed and mobile phones are not allowed.
4. Normal distribution table is printed on the last page for reference. Support your answers with diagrams / illustrations, wherever necessary
6. Graph papers will be supplied on request.
_________________________________________________

Q.1 A) State whether following statements True or False:(Attempt any8) (8)
Q.1B) Match the right and closely related answer from Column Y with the text / term given in Column X. ( Attempt Any 7 questions )
|
Column X |
Column Y |
|
1) Leaner relationship of Variable |
a) Completely utilized resources |
|
2) Infeasible region |
b) Minimum cost in the table |
|
3) Scarce resource |
c) No feasible solution Possible |
|
4) LCM |
d) LPP |
|
5) NWCR |
e) In the game, gains of the winner are equal to
total losses of all other players |
|
6) Critical Activity |
f) Optimistic time |
|
7) Zero sum game |
g) Fair game |
|
8) Shortest activity time in PERT |
h) Zero float value |
|
9) Value of game =0 |
i) The time during which a machine is waiting or not
working |
|
10) Ideal time |
j) Top left side corner of the side |
Column X |
Column Y |
1) Leaner relationship of Variable |
d) LPP |
2) Infeasible region |
c) No feasible solution Possible |
3) Scarce resource |
a) Completely utilized resources |
4) LCM |
b) Minimum cost in the table |
5) NWCR |
j) Top left side corner of the side |
6) Critical Activity |
f) Optimistic time |
7) Zero sum game |
e) In the game, gains of the winner are equal to total losses of all other players |
8) Shortest activity time in PERT |
h) Zero float value |
9) Value of game =0 |
g) Fair game |
10) Ideal time |
i) The time during which a machine is waiting or not working |

|
Material |
Condenser |
Transmitter |
Conductor |
Availability |
|
Engineering |
1 |
1 |
1 |
100 |
|
Direct
labour |
10 |
5 |
4 |
600 |
|
Administration
service |
2 |
6 |
2 |
300 |
|
Required |
100 |
1000 |
1000 |
|
Let X1 : No. of unit of condenser
produce
X2 : No. of unit of Transmitter
produce
X3 : No. of unit of Conductor
produce
Max Z: Profitable of material produce
Max Z: 10 X1 + 16 X2 +
4 X3
Subject Constraints:
X1
+ X2 + X3 ≤ 100 ---
[Engineering hours]
10 X1
+ 5 X2 + 4 X3 ≤ 600 ---- [Direct labour hour]
2
X1 + 6 X2 + 2 X3 ≤ 300 --- [Administration service hours]
X1
, X2 , X3 ≥ 0
Material | Condenser | Transmitter | Conductor | Availability |
Engineering | 1 | 1 | 1 | 100 |
Direct labour | 10 | 5 | 4 | 600 |
Administration service | 2 | 6 | 2 | 300 |
Required | 100 | 1000 | 1000 |
Let X1 : No. of unit of condenser produce
X2 : No. of unit of Transmitter produce
X3 : No. of unit of Conductor produce
Max Z: Profitable of material produce
Max Z: 10 X1 + 16 X2 + 4 X3
Subject Constraints:
X1 + X2 + X3 ≤ 100 --- [Engineering hours]
10 X1 + 5 X2 + 4 X3 ≤ 600 ---- [Direct labour hour]
2 X1 + 6 X2 + 2 X3 ≤ 300 --- [Administration service hours]
X1 , X2 , X3 ≥ 0
Max Z: 10 X1 + 16 X2 + 4 X3
Subject Constraints:
X1 + X2 + X3 ≤ 100 --- [Engineering hours]
10 X1 + 5 X2 + 4 X3 ≤ 600 ---- [Direct labour hour]
2 X1 + 6 X2 + 2 X3 ≤ 300 --- [Administration service hours]
X1 , X2 , X3 ≥ 0
Q.2 C) Five salesmen are to be assigned to five territories. Based on past performance, the following table shows the annual sales (is Rs. lakh) that can be generated by each salesman in each territory. Find optimum assignment to maximize sales
|
Salesman |
Territory |
||||
|
T1 |
T2 |
T3 |
T4 |
T5 |
|
|
S1 |
26 |
14 |
10 |
12 |
9 |
|
S2 |
31 |
27 |
30 |
14 |
16 |
|
S3 |
15 |
18 |
16 |
25 |
30 |
|
S4 |
17 |
12 |
21 |
30 |
25 |
|
S5 |
20 |
19 |
25 |
16 |
10 |
Salesman | Territory | ||||
T1 | T2 | T3 | T4 | T5 | |
S1 | 5 | 17 | 21 | 19 | 22 |
S2 | 0 | 4 | 1 | 17 | 15 |
S3 | 16 | 13 | 15 | 6 | 1 |
S4 | 14 | 19 | 10 | 1 | 6 |
S5 | 11 | 12 | 6 | 15 | 21 |
Salesman | Territory | ||||
T1 | T2 | T3 | T4 | T5 | |
S1 | 0 | 12 | 16 | 14 | 17 |
S2 | 0 | 4 | 1 | 17 | 15 |
S3 | 15 | 12 | 14 | 5 | 0 |
S4 | 13 | 18 | 9 | 0 | 5 |
S5 | 5 | 6 | 0 | 9 | 15 |
Salesman | Territory | ||||
T1 | T2 | T3 | T4 | T5 | |
S1 | 0 | 12 | 16 | 14 | 17 |
S2 | 0 | 4 | 1 | 17 | 15 |
S3 | 15 | 12 | 14 | 5 | 0 |
S4 | 13 | 18 | 9 | 0 | 5 |
S5 | 5 | 6 | 0 | 9 | 15 |
Salesman | Territory | ||||
T1 | T2 | T3 | T4 | T5 | |
S1 | 0 | 12 | 16 | 14 | 17 |
S2 | 0 | 4 | 1 | 17 | 15 |
S3 | 15 | 12 | 14 | 5 | 0 |
S4 | 13 | 18 | 9 | 0 | 5 |
S5 | 5 | 6 | 0 | 9 | 15 |
Salesman | Territory | ||||
T1 | T2 | T3 | T4 | T5 | |
S1 | 0 | 12 | 16 | 14 | 17 |
S2 | 0 | 0 | 1 | 17 | 15 |
S3 | 15 | 12 | 14 | 5 | 0 |
S4 | 13 | 18 | 9 | 0 | 5 |
S5 | 5 | 6 | 0 | 9 | 15 |
|
Salesmen |
Territory |
Sales
(Rs. Lacs) |
|
S1 S2 S3 S4 S5 |
T1 T2 T3 T4 T5 |
26 27 30 30 25 |
|
Optimal Sales
= Rs. 138 Lacs |
Subject to constraints:
4x1 + 3x2 < 24
x1 < 4.5
x2 < 6
x1 , x2 > 0

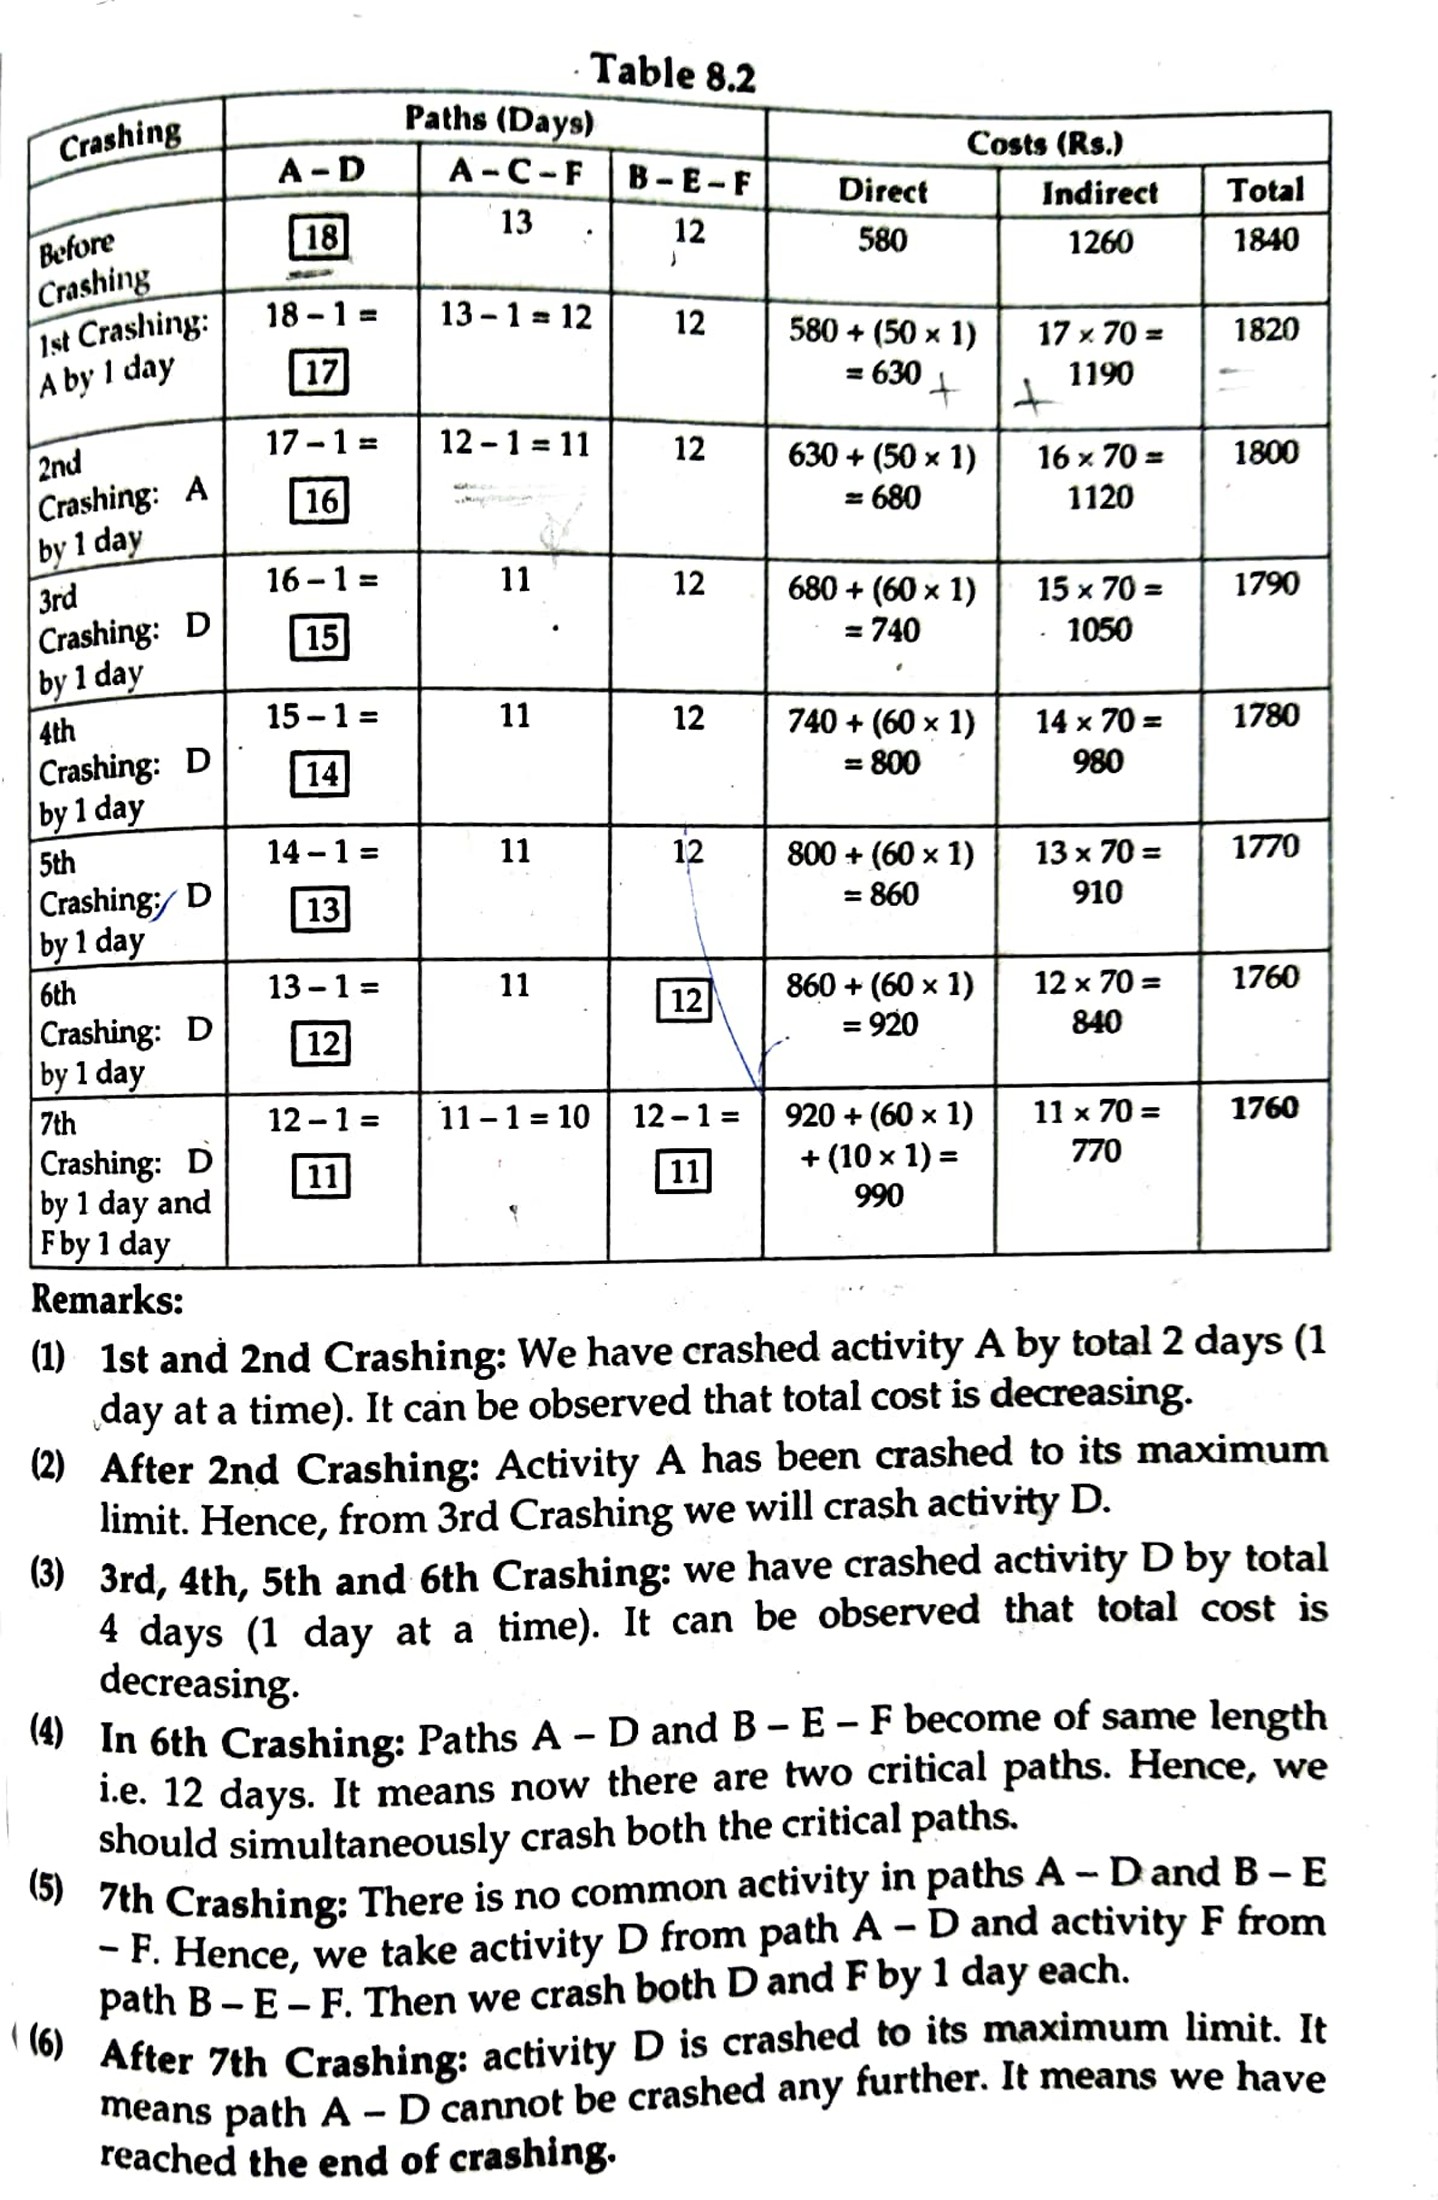
Q.3 A) From the data given below:
1. Draw a diagram (2)
2. Find Critical Path (2)
3. Crash Systematically the activities any determine optimal project duration: (4)
|
Activities |
1-2 |
1-2 |
2-4 |
2-5 |
3-4 |
4-5 |
|
Normal time |
8 |
4 |
2 |
10 |
5 |
3 |
|
Normal cost |
100 |
150 |
50 |
100 |
100 |
80 |
|
Crash time |
6 |
2 |
1 |
5 |
1 |
1 |
|
Crashed cost |
200 |
350 |
90 |
400 |
200 |
100 |
Indirect cost is Rs. 70 per day




_1.jpg)
|
Activities |
Average Expected Time
in weeks (te) |
Standard deviation |
|
1-2 |
3 |
4/6 |
|
1-3 |
4 |
4/6 |
|
2-5 |
5 |
4/6 |
|
2-4 |
6 |
2/6 |
|
5-6 |
7 |
4/6 |
|
4-6 |
8 |
4/6 |
|
3-6 |
9 |
4/6 |
|
6-7 |
3 |
2/6 |
_1.jpg)
_2.jpg)
_1.jpg)
- Find the Maximin strategy.
- Find the Minimax strategy.
- What is the Value of the game.
_1.jpg)
Q.4 B) Six jobs I, II, III, IV, V and VI are to be processed on two machine A and B in order AB
Jobs
Processing
Time (Min.)
Machine
A
Machine
B
I
5
8
II
2
6
III
10
3
Iv
9
4
V
6
3
VI
8
9
(i) Find the sequence that minimizes the total elapsed time required to complete the jobs. (2)
(ii) Calculate the total elapsed time. (3)
(iii) Idle time on for each Machine. (3)
Jobs
Processing
Time (Min.)
Machine
A
Machine
B
I
5
8
II
2
6
III
10
3
Iv
9
4
V
6
3
VI
8
9
OR
Q.4 C) Find the optimal sequence: (8)
Jobs
I
II
III
IV
V
Machine A
3
8
7
5
2
Machine B
3
4
2
1
5
Machine C
5
8
10
7
6
Jobs
I
II
III
IV
V
Machine A
3
8
7
5
2
Machine B
3
4
2
1
5
Machine C
5
8
10
7
6
a) Determine the optimum sequence for performing jobs
b) Total minimum elapsed time
c) Idle time for each machine.
Video Solution;


Q4 (D) you are given the following pay-off matrix of a zero-sum game, determine optimal strategies for the players and the value of the game. (7)
|
A
Strategy |
B
Strategy |
|||
|
|
B1 |
B2 |
B3 |
B4 |
|
A1 |
5 |
-4 |
5 |
9 |
|
A2 |
6 |
2 |
0 |
-3 |
|
A3 |
9 |
15 |
10 |
11 |
|
A4 |
2 |
8 |
-6 |
5 |

Q.5 A) Define Operations Research. Explain limitation of Operation Research.
Ans: Quantitative techniques can be classified in two groups, statistical techniques and programming techniques.
B) Explain various cost involved in project crashing.



.png)
)
0 Comments